
Robust Sampling of Altered Pathways for Drug Repositioning Reveals Promising Novel Therapeutics for Inclusion Body Myositis
Juan Luis Fernández-Martínez*, Oscar Álvarez, Enrique J. DeAndrés-Galiana, Javier Fernández-Sánchez de la Viña, Leticia Huergo
Group of Inverse Problems, Optimization and Machine Learning. Department of Mathematics. University of Oviedo, Oviedo, 33007, Asturias, Spain.
Abstract
In this paper we present a robust methodology to deal with phenotype prediction problems associated to drug repositioning in rare diseases, which is based on the robust sampling of altered pathways. We show the application to the analysis of IBM (Inclusion Body Myositis) providing new insights about the mechanisms involved in its development: cytotoxic CD8 T cell-mediated immune response and pathogenic protein accumulation in myofibrils related to the proteasome inhibition. The originality of this methodology consists of performing a robust and deep sampling of the altered pathways and relating these results to possible compounds via the connectivity map paradigm. The methodology is particularly well-suited for the case of rare diseases where few genetic samples are at disposal. We believe that this method for drug optimization is more effective and complementary to the target centric approach that loses efficacy due to a poor understanding of the disease mechanisms to establish an optimum mechanism of action (MoA) in the designed drugs. However, the efficacy of the list of drugs and gene targets provided by this approach should be preclinically validated and clinically tested. This methodology can be easily adapted to other rare and non-rare diseases.
Introduction
Drug discovery in rare diseases is hampered by intrinsic and extrinsic factors of the drug design process, such as, the limited number of patients affected by the disease and by the increasing costs faced by the pharmaceutical companies to find new therapeutic targets and to bring them to the market. A disease is considered rare (in the USA) if it affecting fewer than 200,000 individuals. As result of this definition and the corresponding epidemiological studies, there are approximately 6800 rare diseases, according to the National Institute of Health. Drug discovery involves the identification of new compounds to successfully treat the diseases, that is, having a mechanism of action (MOA) that provides an optimal therapeutic index by reducing at the same time the outcome of potential side effects, in order to have a favorable safety and efficacy profile. The complexity of this process provokes that new drug development is a capital-intensive process with mean costs estimated to 2.8 billion dollars (DiMasi et al., 2016)1. Although the orphan diseases collectively affect 400 million worldwide, the high developing costs with respect to the small number of affected patients have caused that these diseases were historically neglected by the drug industry. Many of the estimated 5,000 to 8,000 rare conditions are genetic or have a genetic component (NIH, 2010)2. The main approaches in drug discovery include target based drug discovery to modulate a specific gene, and phenotypic drug discovery that measure phenotypes associated with the disease to unravelling translational biomarkers and identifying small molecules with high therapeutic index. Swinney and Xia, (2014)3 remarked that the phenotypic approach generally provides better results. Drug development for rare diseases has additional challenges in comparison to common diseases due to the fewer patients available for inclusion in clinical trials and their geographical dispersion. Therefore, a pragmatic approach is needed for finding novel orphan drugs, since the use of deep learning methodologies is hampered by the limited amount of samples. In this paper we introduce an efficient methodology to address orphan drug discovery in rare diseases, which is based in a robust sampling of the genetic pathways altered by the disease, that is, the set of most discriminatory genes of the IBM phenotype which have been altered by the disease. In this paper we will demonstrate that this robust phenotypic approach is able to obtain interesting results in the case of Inclusion Body Myositis, highlighting viral infection as a possible trigger of this disease and Interferon-gamma-mediated Signaling Pathway as the main mechanism involved. The word robust refers in this case to the algorithm used to characterize these pathways by dealing with the intrinsic high under determinacy of this kind of problems As a result of this analysis, the main altered pathways and different potential orphan drugs are presented. These findings should be preclinically validated and clinically tested.
Understanding defective pathways
Phenotype prediction consists of identifying the set or sets of genes that influence the disease genesis and development and constitutes one of the main challenges faced in drug design. Two main obstacles related to the analysis of genetic data with translational means are the high dimension of the genetic information with respect to the sample dimension, and the absence of a conceptual model that relates the different genetic signatures to the class prediction, more precisely, an operator of the form:
L* (g):g∈Rs→C={1,2}, (1)
that links the genetic signature g to the set of classes C={1,2} in which the phenotype is divided (in the case of a binary classification problem). In practice the phenotype division C={1,2} might correspond to different interesting problems in drug design, such as, unravelling the altered genetic pathways in a disease (see for instance Fernández-Martínez et al., 2017)4; understanding the mechanisms of action of a drug (MoA) in a specific context (see for instance Chen et al., 2016)5, or the genetic pathways that might be responsible of undesirable side effects (see for instance Reinbolt et al., 2018)6.
Microarray technologies provide relative levels of gene expression in the transcriptome, and can be efficiently modelled to unravel the altered genetic pathways in a disease, that regulate important cellular mechanisms, signaling events, or have important protein coding functions. Following this approach the data consists in an expression matrix E of different samples (patients and healthy controls). The rows in the matrix are the samples that are monitored in the analysis, and the columns are the genetic probes that are measured in each sample. We also need the array (cobs) that provides the observed classes of the set of samples that have monitored and form the training dataset, informed by medical doctors.
Finding the discriminatory genetic signatures corresponding to the classifier L* (g), involves solving the optimization of the cost function
O(g)=L* (g)-cobs 1, (2)
to measure the difference between the observed classes (cobs) and the corresponding set of predictions L* (g), via the genetic signature g and the classifier L*. The notation L* (g)-cobs 1 represents the prediction error, which coincides with the number of uncorrected samples predicted by the classifier and is related to the accuracy of L* according to g: Acc(g)=100- O(g).
This kind of prediction problems are highly underdetermined since the number of monitored genetic probes is always much larger than the number of disease samples, and consequently, the associated uncertainty space of these problems is huge. Mathematically, the uncertainty space relative to L* is composed by the sets of high predictive genetic networks with similar predictive accuracy:
Mtol = {g: 0(g) < tol}. (3)
Expression (3) means that the uncertainty space of the phenotype prediction problem contains all the genetic networks whose predictive accuracy is greater than 100-tol: Acc(g)> 100-tol.
The sampling and posterior analysis of Mtol is crucial, since the genetic signatures contained in this set are expected to be involved in the disease development. The high degree of under-determinacy of the learning problem (2) makes the characterization of the involved biological pathways to be very ambiguous (De Andrés-Galiana et al., 2016a)7. Noise in data (expression matrix E) and in the class assignment (cobs) provoke that the genetic signature with the highest predictive accuracy cannot explain the origin of the disease (De Andrés-Galiana et al., 2016 b)8.
The methodology presented in this paper is based in the following assumption: “the high discriminatory genetic networks in Mtol are involved in the mechanistic pathways that serve to explain the disease development, and therefore can be used to finding orphan drugs able to re-establish the homeostasis perturbed by the disease”. The algorithm used to sample Mtol was the holdout sampler (Fernández-Martínez et al., 2018a)9, that generates different random 75/25 data bags (or holdouts), where 75 % of the data in each bag is used for learning and 25% for blind validation. For each of these bags the small-scale genetic signature is found. The posterior analysis consists of finding the most frequently sampled genes, taking into account all the high predictive networks (small-scale genetic signatures with high validation accuracy), serves to establish the defective genetic pathways using ontological platforms. This holdout sampler has been successfully applied in other fields to sample the uncertainty space in different technological inverse problems (Fernández-Martínez et al., 2018b; Fernández-Muñiz et al., 2019)10,11. In this paper we took a step forward, and the knowledge issued from this analysis is used to perform drug repositioning using the connectivity map paradigm (Lamb et al., 2006)12.
Material and Methods. Application to IBM
State-of-the-art
Inclusion Body Myositis (IBM) is the most common inflammatory muscle disease characterized by progressive muscle weakness in older adults. The progressive course of IBM leads slowly to severe disability. IBM is a rare disease with a very low prevalence rate. The causes for IBM are unknown. Two main theories coexist: the first one suggests an inflammation-immune reaction triggered by a virus (Ghannam et al., 2014)13, and the second one a degenerative disorder related to aging of the muscle fibers and an abnormal pathogenic protein accumulation in myofibrils related to the proteasome inhibition (Rose, 2013)14.
According to cureibm.org the clinical trials in IBM include the following treatments:
1. Arimoclomol (University College, England): this drug targets the proper folding of the proteins to clearing away the abnormal clumps in the muscle.
2. Pioglitazone (Johns Hopkins University, USA): this drug, used for diabetes), targets the improvement of the function of defective mitochondria to increase muscle strength.
3. Rapamycin (Hôpital Pitié-Salpetriêre, France): this drug regulates cell growth and metabolism and has an immunosuppressive effect, and was used to prevent kidney transplant rejection. This drug failed to show efficacy, although the patients treated improved 6-minutes distance walked.
4. Follistatin: this drug is used to block myostatin, a protein which inhibits muscle growth. Blocking myostatin allows the muscles to grow. No adverse effects were detected, and patients who received the therapy improved in a 6-minute walk test.
This knowledge is important to understand the therapeutic hypothesis that are currently used and comparing to the novel results that are presented in this paper.
The data
The microarray dataset that we interpreted to analyze IBM contains 22283 genetic probes and 34 samples: 11 healthy controls and 23 IBM samples (Greenberg et al., 2002, 2005)15,16. Class 1 corresponds to healthy controls and class 2 to IBM patients. This genetic experiment has a very high underdetermined character since the number of genetic probes is 655 greater than the number of samples. As it has been previously highlighted, this is a common feature of all phenotype prediction problems, that brings ambiguity in the phenotype prediction if the modelling approach that is used is not able to handle this intrinsic feature, that highly impacts the results obtained in the drug design process. This dataset al.so contained 6 samples of patients with polymyositis (PM).
Results and discussion
Altered genetic pathways
Table 1 shows the list of the most frequently sampled genes by the holdout sampler, divided into two categories: over-expressed (expression in IBM higher than in healthy controls) and under-expressed. This list contains the most important 37 genes in each category, that can be clustered into the main following families:
• HLA genes belonging to the Major Histocompatibility complex class I (HLA-A, HLA-B, HLA-C, HLA-G, HLA-E);
Table 1. List of over-expressed and under-expressed genes in the set of most discriminatory genes of the IBM vs healthy controls (HC) phenotype. Over-expression means in this case higher expression in IBM patients than in HC.
| Over-expressed genes/probes | Under-expressed genes/probes |
|---|---|
| HLA-B | NDUFS7 |
| HLA-C | EIF1 |
| 206559_x_at | CAPN3 |
| EEF1A1 | SLC38A3 |
| HLA-G | PFKFB1 |
| TIMP1 | RAD23A |
| FTL | TMEM159 |
| S100A6 | MIR6778 /// SHMT1 |
| HCRP1 | EIF1 |
| STAT1 | EEF1G /// MIR3654 |
| MIR7703 /// PSME2 | YBX3 |
| TUBA1B | PNPLA4 |
| BTN3A3 | AQP4 |
| LOC101060363 /// PPIA | DTNA |
| C11orf48 /// LOC102288414 | GLUL |
| HLA-F | EEF1G /// MIR3654 |
| RPS4Y1 | LGR5 |
| IRF9 | ITGB6 /// LOC100505984 |
| PRUNE2 | PBX1 |
| IL32 | RS1 |
| TMSB10 | EIF4B |
| ACTB /// ACTG1 | ITGB6 /// LOC100505984 |
| S100A4 | 216737_at |
| SP100 | DHPS |
| B3GALT4 | GRB10 |
| CD24 | LMCD1 |
| ATP6V0E2 | ACTN2 |
| MLLT11 | IDE |
| NANS | SAMD4A |
| CDKN1A | RXRA |
| IGK /// IGKC | USP24 |
| UCP2 | YBX1 |
| PARP12 | CARM1 |
| TUBA1C | PAIP2B |
| ESYT1 | EEF2 |
| LOC101060363 /// PPIA | SIX1 |
• Immunoglobulin Kappa genes (IGK, IGKC));
• Actin genes (ACTB, ACTG1); Calcium binding Protein genes (S100A4, S100A6);
• Interferon Regulatory genes (IRF9).
• Ferritin production genes (FLT).
• Genes related to Immunodeficiency (B2M, STAT1), and
• Tubulin genes (TUBA1B).
These genes are also related to other disease phenotypes, such as Muscular Dystrophy, HIV type 1 and Becher Muscular Dystrophy. This knowledge is important because it shows how different phenotypes are related and can guide the drug repositioning in some cases, that is, drugs used for that diseases could be useful to treat IBM.
The main pathways issued from this analysis were:
• Antigen processing and presentation (B2M and HLA genes).
• Immune Response Role of DAP12 receptors in NK cells (actin, HLA and Immunoglobulin Kappa genes).
• Phagosome (actin, HLA and tubulin genes).
• Immune response IFN alpha/beta signaling pathway (STAT1, IRF9 and HLA genes).
• Influenza A pathway (STAT1, IRF9, actin and HLA genes).
• Interferon Gamma Signaling (B2M, STAT1, IRF9 and HLA genes).
Besides, the main biological processes involved were:
• Antigen Processing and Presentation.
• Interferon-gamma-mediated Signaling Pathway.
• Antigen Processing and Presentation of Peptide Antigen via MHC Class I.
• Type I Interferon Signaling Pathway.
• Regulation of Immune Response.
The same pathways (Immune System/ Interferon Gamma Signaling/ Immune Response IFN Alpha/beta Signaling Pathway/ Cytokine Signaling in Immune System/ Antigen Presentation- Folding, Assembly and Peptide Loading of Class I MHC/ Type II Interferon Signaling (IFNG)/ NF-kappaB Signaling/ Antigen Processing-Cross Presentation/ Natural Killer Cell Receptors/ Influenza A/ Immune Response Role of DAP12 Receptors in NK Cells/ Viral Carcinogenesis) were also found for PM patients. This result suggests that the results shown in this paper might be generalizable to the entire class of inflammatory myopathies. Table 2 shows the results of the pathway analysis provided by Enrichr2016 (Kuleshov et al., 2016)17, confirming the results of the previous pathway analysis.
Table 2. Main pathways provided by Enrichr2016 using different ontological databases.
| Database | Pathways |
| KEG | Phagosome/ Viral myocarditis/Viral carcinogenesis/ Antigen processing and presentation/ Herpes simplex infection/ Allograft rejection/ Graft-versus-host disease/ Type I diabetes mellitus/ Autoimmune thyroid disease/ Pathogenic Escherichia coli infection |
| WikiPathways | Allograft Rejection/ Translation Factors/ Proteasome Degradation/ Cardiomyopathy/ Translation Factors muscles/ Pathogenic Escherichia coli infection/ Type II interferon signaling (IFNG)/ TGF-beta Receptor Signaling/ Interferon type I signaling pathways/ Integrated Pancreatic Cancer Pathway. |
| REACTOME | Endosomal-Vacuolar pathway/ Interferon gamma signaling/ Antigen Presentation: Folding, assembly and peptide loading of class I MHC/ ER-Phagosome pathway/ Antigen Processing-Cross presentation/Interferon Signaling/ Interferon alpha-beta signaling/ Cytokine Signaling in Immune system/ Immunoregulatory interactions between a Lymphoid and a non-Lymphoid cells/ Immune System. |
| NCI-Nature | Glucocorticoid receptor regulatory network/ Signaling events mediated by PRL/IL6-mediated signaling events/IFN-gamma pathway/Signaling events mediated by Stem cell factor receptor (c-Kit)/ Signaling events mediated by HDAC Class III/Regulation of Androgen receptor/IL12-mediated signaling events/mTOR signaling pathway/PDGFR-beta signaling pathway. |
Drug repositioning for IBM
The final step consists in using the knowledge that has been gained, to select one or several targets and applying the state-of-the-art in drug repositioning (Bezerianos et al., 2017)18. In this case we have used the Connectivity Map (CMAP 02) web application from the Broad Institute, which serves to identify potential biological relationships between drugs and orphan diseases modelling transcriptomic data (Lamb et al., 2006)12. CMAP searches for drugs tested in different cell lines at different doses that are able to re-establish the homeostasis, that is, the overexpressed genes in the disease are down-regulated and the under-expressed genes are increased in expression. CMAP uses a modified Kolmogorov-Smirnov test to calculate the similarity of a drug perturbed expression profile to the gene expression profile used to query the database. This algorithm also considers the opposite effects of the drug to decrease its score. As indicated by CMAP, when the up- and down-regulated lists correspond to the disease state, then the perturbagens with the most negative connections would correspond to potential treatments, while the ones with the most positive scores will elicit transcriptional effects similar to the disease state. It should be noted that the algorithm used for drug discovery is deterministic, that is, the drugs that are found do not change as far as the lists of over-expressed and under-expressed genes remain the same. This fact highlights the importance of using a robust method for pathway analysis. The genes that are used to establish the drugs hits are those that are highly correlated to the phenotype.
Table 3 shows the drugs found by CMAP with positive effects and best scores (smaller than -0.90). The drug with the highest score found was chlormezanone, which is a muscle relaxant. This drug has as main side effect to cause toxic epidermal necrolysis. Thapsigargin is an inhibitor of the sarco-endoplasmic reticulum Ca2+ ATPase (SERCA), and inhibits the fusion of autophagosomes with lysosomes which is the last step in the autophagic process. The inhibition of the autophagic process induces stress on the endoplasmic reticulum and leads to cellular death (Ganley et al., 2011)19 comes in the second place. Felodipine is a calcium channel blocker type used to treat high blood pressure. Palmatine is a protoberberine alkaloid that has several pharmacological activities, including antimicrobial, glucose and cholesterol-lowering, antitumoral, and immunomodulatory properties (Cai et al., 2016)20. Oxaprozin is a non-steroidal anti-inflammatory drug and apoptotic agent that inhibits Akt, NF-κB and caspase-3 activation. IKK/NF-κB inhibition causes antigen presenting cells to undergo cell death (Tilstra et al., 2014)21. Clorsulon is an anthelmintic agent. Cefotaxime is an antibiotic used to treat a number of bacterial infections, such as, Staphylococcus aureus, which is one bacteria whose pathways appeared to associated to IBM in this analysis.
Table 3. A) List of main compounds found by CMAP with positive effects (potential treatments).
| CMAP name | dose | cell | score | up | down |
|---|---|---|---|---|---|
| chlormezanone | 15 µM | HL60 | -1 | -0.334 | 0.239 |
| thapsigargin | 100 nM | MCF7 | -0.99 | -0.326 | 0.241 |
| felodipine | 10 µM | MCF7 | -0.974 | -0.397 | 0.16 |
| palmatine | 10 µM | HL60 | -0.972 | -0.261 | 0.296 |
| oxaprozin | 300 µM | MCF7 | -0.949 | -0.191 | 0.352 |
| clorsulon | 11 µM | MCF7 | -0.94 | -0.314 | 0.224 |
| chlorprothixene | 11 µM | HL60 | -0.932 | -0.274 | 0.259 |
| cefotaxime | 8 µM | HL60 | -0.93 | -0.321 | 0.211 |
Table 4 shows the drugs found by CMAP with adverse effects, that is, promoting gene regulations against homeostasis. The drug with the highest score found was suloctidil, which is a vasodilator to treat cerebral vascular disorders. Trichostatin A, which is Histone Deacetylase Inhibitor (HDI) that decreases cholesterol levels in neuronal cells by modulating key genes in cholesterol synthesis (Nunes et al., 2017)22. This drug also has showed positive effects with respect to the disease when used in prostate cancer cell-lines. Vorinostat is also an HDI. Oxedrine is also a cardiac stimulant. One of the major limitations of this approach is that drugs are not tested in muscle cell lines. In fact, the results showed in Table 4 showed three cell lines: HL60 (human leukemia cell line), MCF7 (human breast adenocarcinoma cell line) and PC3 (human prostate cancer cell line). Therefore, these results should be interpreted with caution in the case of muscle cell lines. We have also used the LC1000CDS package from NIH-LINCS program (http://www.lincsproject.org) to look for potential treatments. Table 5 shows the main compounds obtained to reverse the disease signature. This table highlights different combinations of Exemestane and Rimexolone. Exemestane is an aromatase inhibitor and Rimexolone is a glucocorticoid steroid used to treat eye inflammation and keratitis.
Table 4. List of main compounds found by CMAP02 with similar effects to the disease state.
| CMAP name | dose | cell | score | up | down |
|---|---|---|---|---|---|
| suloctidil | 12 µM | HL60 | 1 | 0.413 | -0.235 |
| trichostatin A | 100 nM | MCF7 | 0.93 | 0.464 | -0.139 |
| trichostatin A | 1 µM | MCF7 | 0.915 | 0.369 | -0.223 |
| trichostatin A | 100 nM | MCF7 | 0.912 | 0.398 | -0.192 |
| oxedrine | 24 µM | HL60 | 0.911 | 0.287 | -0.303 |
| vorinostat | 10 µM | MCF7 | 0.901 | 0.446 | -0.138 |
Table 5. List of the main compounds found by LC1000DCS.
| Score | Combination |
|---|---|
| 0.2836 | Exemestane BRD-K48016779 |
| 0.2687 | Exemestane PHENOLPHTHALEIN |
| 0.2687 | Exemestane BRD-A24054354 |
| 0.2687 | Rimexolone BRD-A24054354 |
| 0.2687 | Exemestane BRD-K53472085 |
Figure 1 shows the correlation tree among the most discriminatory genes of the IBM phenotype (DeAndrés-Galiana et al., 2016a)7. This tree is built via the minimum spanning tree (Kruskal, 1956)23 using the Pearson correlation coefficient among the most discriminatory genes of the IBM phenotype. This tree has a header gene (HLA-C) who is connected to other edges with the highest absolute value of the correlation coefficient between gene expressions. Therefore, this tree can be used to understand how the gene expression of the most important discriminatory genes of the IBM phenotype is inter-regulated.
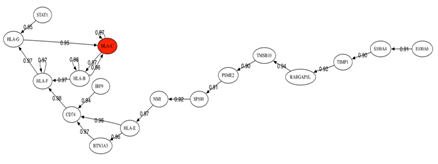
Fig. 1: Correlation tree among the most discriminatory genes of the IBM phenotype.
It can be observed that STAT1 impacts positively the expression of HLA-G and this gene impacts the header gene HLA-C, which is the one with the highest discriminatory power. All these genes are up-regulated in IBM patients.
Therefore, down-regulation of STAT1 will induce down-regulation of HLA-C. Hu et al. (2003)24 have reported the inhibition of IFN-gamma signaling by glucocorticoids: IFN-gamma signaling can be achieved by regulating STAT1 expression. Based on these results, targeting genes that regulates the Interferon-gamma-mediated Signaling Pathway holds the most promise. Other possible targets are the down-regulation of CD74, IRF9, BTN3A3, NMI and other genes that are located in the lower branches of the tree. Using the information provided by this correlation tree and Gene Analytics (Stelzer et al., 2009)25 we have found several compounds that act on the genes of this tree (Table 6). This software does not provide how the compound impacts the gene expression. Particularly they are of special interest those compounds that act on the header genes (highlighted in bold):
Table 6. Compounds found by Gene Analytics acting on the main genes (headers) of the correlation tree shown in Figure 1.
| Name | Matched Genes |
|---|---|
| Decitabine | HLA-B HLA-G, STAT1, TIMP1, S100A4. |
| Oligonucleotide | HLA-G, HLA-B, STAT1, IRF9, S100A4, S100A6. |
| Retinoic Acid | HLA-B, STAT1, IRF9, S100A4, S100A6, SP100, TIMP1. |
| Tyrosine | HLA-B, STAT1, IRF9, TIMP1, S100A4. |
| Ifn-alpha | HLA-G, STAT1, IRF9 |
| 2,5-Oligoadenylate | HLA-B, STAT1, IRF9 |
| Matrigel | HLA-G, STAT1, S100A4, TIMP1. |
| Ribavirin | HLA-B, STAT1, TIMP1. |
| VEGF | HLA-G, STAT1, TIMP1, TMSB10. |
| Cyclosporine | HLA-B, STAT1, TIMP1 |
| Ribonucleic Acid | HLA-G, HLA-B, TIMP1 |
| Progesterone | HLA-G, STAT1, S100A4, S100A6, TIMP1. |
| Rosiglitazone | STAT1, TIMP1. |
| Niclosamide | STAT1, S100A4. |
| PD98059 | STAT1, TIMP1. |
• Decitabine is a Nucleic Acid Synthesis Inhibitor used to treat myelodysplastic syndromes and acute myeloid leukemia.
• Oligonucleotides are small RNA molecules that serve to regulate gene expression.
• Retinoic acid is a metabolite of Vitamin A, and Tyrosine is one of the 20 standard amino acids used by the cells to synthesize proteins.
• Interferon alfa (INN) is a drug composed of natural interferon alpha (IFN-α) obtained from the leukocyte fraction of human blood treated with Sendai virus. This drug enhances the proliferation of human B cells and activates NK cells.
• 2-5'-oligoadenylate synthetase is an antiviral enzyme that counteracts viral attack by degrading viral and host RNA.
• Ribavirin is a synthetic guanosine nucleoside and antiviral agent that interferes with the synthesis of viral mRNA. It is used for treating hepatitis C and viral hemorrhagic fevers.
• VEGF (Vascular Endothelial Growth Factor) is a signal protein that stimulates the formation of blood vessels.
• Cyclosporine is an immunosuppressant medication used in rheumatoid arthritis and in organ transplants to prevent rejection. Its mechanism of action consists in lowering the activity of T-cells.
• RNA is used to treat and prevent Alzheimer and also to improve the immune system function.
• Progesterone serves as an intermediate in the biosynthesis of steroid hormones and adrenal corticosteroids.
• Rosiglitazone is an anti-diabetic drug that has an anti-inflammatory effect because NF-κB levels fall and inhibitor levels increase in patients on rosiglitazone.
• Niclosamide is used for the treatment of most tapeworm infections.
• PD98059 is a potent and selective inhibitor of MAP kinase kinases (MAPKK), MEK1 and MEK2 [Alesi et al., 1995]26. PD98059 can inhibit the lipopolysaccharide (LPS)-induced production of cytokines such as TNF-α (Reilin et al., 2001)27.
Finally, there exist natural products such as fish-oil, curcumin, olive leaf extract, glucosamine, lithium, resveratrol or Omega-3 fatty acids that are recognized by their effect in lowering interferon gamma response in cell lines and animal models (see for instance Zang et al., 2011; Wallace et al., 2001; Rowse et al. 2012; Guang-Xiang et al., 2005, etc)28, 29, 30, 31. We believe that the research on rare diseases should benefit from both, orphan drugs and the analysis of mechanisms of action contained in these natural substances, to treat these diseases and improving the life of patients.
Conclusions
In conclusion this paper shows a simple and fast methodology to reposition drugs for drug diseases that works with very few patient samples. The methodology serves to generate new therapeutic targets and repositioning drugs for pre-clinical validation and clinical test, accelerating the finding of new therapies. We have shown the application to IBM using publicly available transcriptomic data. Interestingly, only weak relationships exist among the drugs used in IBM clinical trials and the results that have been shown here. This research highlights some pathways that are widely accepted to play a role in inflammatory myopathies, such as the Major Histocompatibility Complex (MHC) class I molecules and transcription factors involved in MHC class I presentation, showing the relevance of the cytotoxic CD8 T cell-mediated immune response and also the importance of some genes involved in protein degradation in inflammatory myopathies. These pathways are also common to Polymyositis. We make the hypothesis that an inflammation-immune reaction triggered by viruses or bacteria is taking place, and might be also responsible of the poor protein degradation and recycling provoking an abnormal pathogenic protein accumulation in the myofibrils (Rose, 2013)14.
This paper shows that a correct understanding of the altered genetic pathways is very important in drug repositioning. The target-centric approach without consideration of an optimal MoA has been considered as the main responsible of the high attrition rates and the low productivity in pharmaceutical research and development (Swinney and Jason, 2011)32. Robust methods for sampling the altered pathways and dealing with the high intrinsic degree of uncertainty of these problems are needed. This is the case of the holdout sampler designed by our team and used in this paper, that has also provided excellent results in the uncertainty analysis in other technological fields. The knowledge issued from the pathways analysis is used to perform drug repositioning via the Connectivity Map paradigm. Tools such as CMAP/LC1000CDS/Gene-Analytics serve to locate compounds that are able to act (and reverse) on the genetic signature perturbed by the disease in order to achieve homeostasis. These compounds can be considered as potential treatments. The drugs that were repositioned by CMAP belong to several categories: muscle relaxants, calcium channel blockers, antimicrobial agents, non-steroidal anti-inflammatory drugs, anthelmintic agents and antibiotics to treat bacterial infections. LC1000CDS highlighted different combinations of Exemestane (aromatase inhibitor) and Rimexolone (glucocorticoid steroid). The knowledge provided by the robust sampling of the altered pathways is useful to design target-centric approaches based on the main altered pathways as we have shown using Gene-Analytics. This package provided different compounds acting on the header genes of the correlation tree of the IBM phenotype, highlighting the importance of compounds acting on antiviral agents and on the interferon pathways. We hope that the results provided in this paper on inflammatory myopathies (IBM) help to improve the understanding of this disease in order to guide future clinical trials. Finally, this methodology can be easily applied to other rare and non-rare diseases.
Computational methods
The computational methods used to establish the list of genes that are perturbed by the diseases are:
1. The holdout sampler combined with filter reduction methods (Fernández-Martínez et al., 2018a)9. In each holdout the discriminatory genes are those that are differentially expressed and have the highest Fisher’s ratio. A k-NN classifier (DeAndrés Galiana et al., 2016a, 2016b)7,8 is used to establish the cross-validation accuracy of these genetic networks. This approach is named in this paper as Robust Pathways Sampling, since it serves to unravel different high discriminatory genetic networks, instead of using just the one with the highest accuracy (see figure 2).
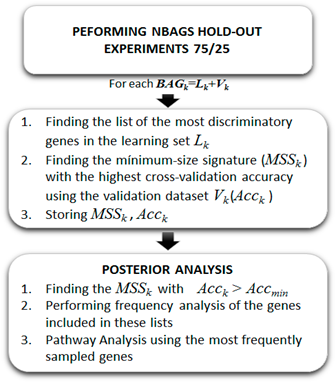
Fig. 2: The Holdout Sampler workflow used to perform the robust sampling of altered genetic pathways (from Fernández-Martínez et al., 2018)
The posterior analysis of the most frequently sampled genes in the uncertainty space of the phenotype prediction, Mtol, consists in a frequency analysis of the most frequently sampled genes in the different high discriminatory networks that have been sampled. Based on this analysis, and establishing a cut-off frequency that depends on the problem, the lists of over-expressed and under-expressed genes is selected.
3. The pathway enrichment and drug repositioning algorithms using the most-frequently sampled genes (Lamb 2006; Stelzer et al. 2009; Kuleshov et al., 2016)12,17, 25.
Acknowledgments
We acknowledge Dr. Gonzalo Gómez-López from CNIO (Spain) and the CLUE Team at the Broad Institute clue.io) for their help orienting us about the use of CMAP02; Dr. Segundo González and Christian Sordo-Bahamonde (University of Oviedo) for helping us to interpret the altered pathways in IBM, and finally Dr. Stephen T. Sonis (Brigham and Women's Hospital and Biomodels) and Dr. Andrzej Andrzej Kloczkowski (The Research Institute at Nationwide Children's Hospital) for their inspiring unconditional support.
References
-
- DiMasi JA, Grabowski HG, Hansen RW. Innovation in the pharmaceutical industry: New estimates of R&D costs. J Health Econ. 2016; 47: 20-33.
- NIH, 2010. Rare Diseases and Orphan Products. Accelerating Research and Development. National Academies Press, ISBN-10: 0-309-15806-0.
- Swinney DC, Xia S. The discovery of medicines for rare diseases. Future Med Chem. 2014; 6: 987-1002.
- Fernández-Martínez JL, deAndrés-Galiana EJ, Sonis ST. Genomic data integration in chronic lymphocytic leukemia. J Gene Med. 2017; 19: e2936.
- Chen P, Mancini M, Sonis ST, et al. A novel peptide for simultaneously enhanced treatment of head and neck cancer and mitigation of oral mucositis. PLoS One. 2016; 11: e0152995.
- Reinbolt RE, Sonis S, Timmers CD, et al. Genomic risk prediction of aromatase inhibitor-related arthralgia in patients with breast cancer using a novel machine-learning algorithm. Cancer Med. 2018; 7: 240–253.
- deAndrés-Galiana EJ, Fernández-Martínez JL, Sonis ST. Design of Biomedical Robots for Phenotype Prediction Problems. J Comp Biol. 2016a; 23: 678-692.
- deAndrés-Galiana EJ, Fernández-Martínez JL, Sonis ST. Sensitivity analysis of gene ranking methods in phenotype prediction. J Biomed Inf. 2016b: 64: 255-264.
- Fernández-Martínez JL, Cernea A, deAndrés-Galiana EJ, et al. Sampling defective pathways in phenotype prediction problems via the Holdout sampler. In: Rojas I., Ortuño F. (eds) Bioinformatics and Biomedical Engineering. IWBBIO 2018. Lecture Notes in Computer Science. 2018a; vol 10814. Springer, Cham.
- Fernández-Martínez JL, Fernández-Muñiz Zulima, Breysse Denys. The uncertainty analysis in linear and nonlinear regression revisited: application to concrete strength estimation. Inverse Problems in Science and Engineering. 2018b. DOI: 10.1080/17415977.2018.1553969.
- Fernández-Muñiz Z, Hassan K, Fernández-Martínez JL. Data kit inversion and uncertainty analysis. J Appl Geophys, 2019; 161: 228-238.
- Lamb J. The Connectivity Map: Using Gene-Expression Signatures to Connect Small Molecules, Genes, and Disease. Science. 2006; 313: 1929–1935.
- Ghannam K. Upregulation of immunoproteasome subunits in myositis indicates active inflammation with involvement of antigen presenting cells, CD8 T-cells and IFNGamma. PLoS One. 2014; 9: e104048.
- Rose MR. 188th ENMC International Workshop: Inclusion Body Myositis, 2-4 December 2011, Naarden, The Netherlands. Neuromuscul Disord. 2013; 23: 1044-1055.
- Greenberg SA, Sanoudou D, Haslett JN, et al. Molecular profiles of inflammatory myopathies. Neurology. 2002; 22: 1170-1182.
- Greenberg SA, Bradshaw EM, Pinkus JL, et al. Neurology Dec. 2005; 65: 1782-1787.
- Kuleshov MV, Jones MR, Rouillard AD, et al. Enrichr: a comprehensive gene set enrichment analysis web server 2016 update. Nucleic Acids Res. 2016; 44: W90-7.
- Bezerianos A, Dragomir A, Balomenos P. Computational methods for processing and analysis of biological pathways, 1st Edition, Springer Brief in Computer Science, 2017.
- Ganley IG, Wong PM, Gammoh N, et al. Distinct Autophagosomal-Lysosomal Fusion Mechanism Revealed by Thapsigargin-Induced Autophagy Arrest. Molecular cell. 2011; 42: 731 – 743.
- Cai Z, Wang C, Yang W. Role of berberine in Alzheimer's disease. Neuropsychiatr Dis Treat. 2016; 12: 2509-2520.
- Tilstra JS, Gaddy DF, Zhao J, et al. Pharmacologic IKK/NF-κB inhibition causes antigen presenting cells to undergo TNFα dependent ROS-mediated programmed cell death. Scientific reports. 2014; 4: 3631.
- Nunes MJ, Moutinho M, Gama MJ, et al. Histone Deacetylase Inhibition Decreases Cholesterol Levels in Neuronal Cells by Modulating Key Genes in Cholesterol Synthesis, Uptake and Efflux. PLoS ONE. 2013; 8: e53394.
- Kruskal JB. On the shortest spanning subtree of a graph and the traveling salesman problem. Proceedings of the American Mathematical Society. 1956; 7: 48–50.
- Xiaoyu Hu, Wai-Ping Li, Charis Meng, et al. Ivashkiv. Inhibition of IFN-γ Signaling by Glucocorticoids. J Immunol. 2003; 170: 4833-4839.
- Stelzer G, Inger A, Olender T, et al. GeneDecks: paralog hunting and gene-set distillation with GeneCards annotation. OMICS. 2009; 13: 477.
- Alessi DR, Cuenda A, Cohen P, et al. PD 098059 is a specific inhibitor of the activation of mitogen-activated protein kinase kinase in vitro and in vivo. J Biol Chem. 1995; 270: 27489-27494.
- Reiling N, Blumenthal A, Flad HD, et al. Mycobacteria-induced TNF-alpha and IL-10 formation by human macrophages is differentially regulated at the level of mitogen-activated protein kinase activity. J Immunol. 2001; 167: 3339-3345.
- Zang N, Xie X, Deng Y, et al. Resveratrol-mediated gamma interferon reduction prevents airway inflammation and airway hyperresponsiveness in respiratory syncytial virus-infected immunocompromised mice. Journal of virology. 2011; 85: 13061-13068.
- Wallace FA, Miles EA, Evans C, et al. Dietary fatty acids influence the production of Th1? but not Th2?type cytokines. Journal of Leukocyte Biology. 2001; 69: 449-457.
- Rowse AL, Naves R, Cashman KS, et al. Lithium controls central nervous system autoimmunity through modulation of IFN-γ signaling. PloS one. 2012; 7: e52658.
- Guang-Xian Z, Shuo Yu, Bruno G, et al. Glucosamine Abrogates the Acute Phase of Experimental Autoimmune Encephalomyelitis by Induction of Th2 Response. The Journal of Immunology. 2005; 175: 7202-7208.
- Swinney DC, Jason TI. How were new medicines discovered? Nature Reviews Drug Discovery. 2011; 10: 507–519.